Introduction:
- Metrics can be defined as “STANDARDS OF MEASUREMENT”.
- A Metric is a unit used for describing or measuring an attribute.
- Test metrics are the means by which software quality can be measured.
- The test provides visibility into the readiness of the product and gives a clear measurement of the quality and completeness of the product.
What are Test Metrics?
Test Metrics are the quantitative measure used to estimate the progress, quality, and other activities of the software testing process.
Why do we Need Metrics?
“You cannot improve what you cannot measure.”
“You cannot control what you cannot measure”
AND TEST METRICS HELP IN
Take decisions for the next phase of activities
Evidence of the Claim or Prediction
Understand the type of improvement required
Take decisions on process or technology changeset
Types of Test Metrics
Base Metrics (Direct Measure)
Base metrics constitute the raw data gathered by a Test Analyst throughout the testing effort. These metrics are used to provide project status reports to the Test Lead and Project Manager; they also feed into the formulas used to derive Calculated Metrics.
Ex: # of Test Cases, # of Test Cases Executed
Calculated Metrics (Indirect Measure)
Calculated Metrics convert the Base Metrics data into more useful information. These types of metrics are generally the responsibility of the Test Lead and can be tracked at many different levels (by module, tester, or project).
Ex: % Complete, % Test Coverage
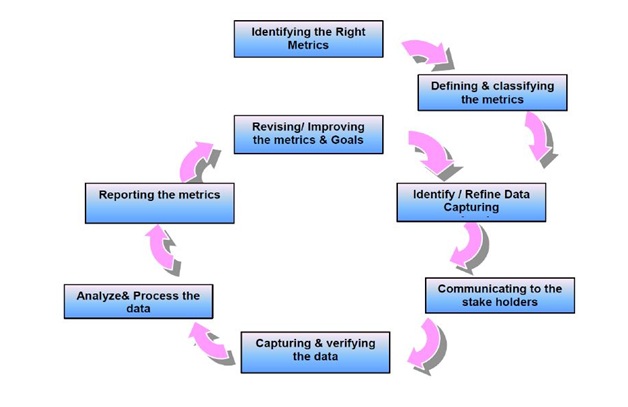
Metrics Life Cycle
Defect Metrics
Release Criteria
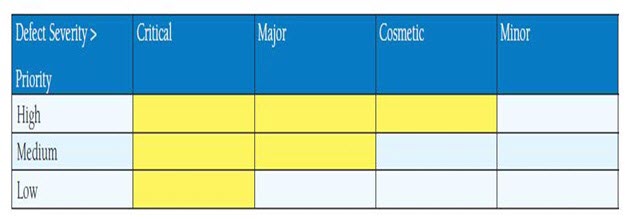
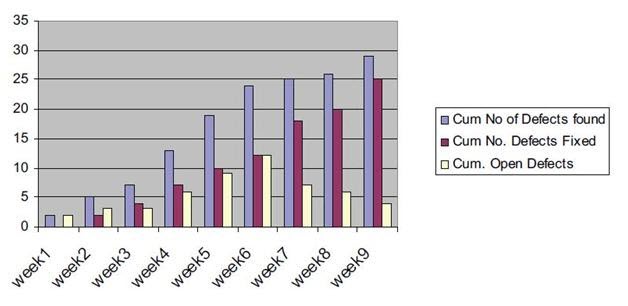
Defect Pattern
Test Plan Coverage on Functionality:
The total number of requirements v/s number of requirements covered through test scripts.
- (No of requirements covered / total number of requirements) * 100
Define requirements at the time of Effort estimation
Example: Total number of requirements estimated is 46, the total number of requirements tested 39, and blocked 7…define what is the coverage?
Note: Define requirements clearly at the project level
Test case Defect Density:
The total number of errors found in test scripts v/s developed and executed.
- (Defective Test Scripts /Total Test Scripts) * 100
Example: Total test script developed 1360, total test script executed 1280, total test script passed 1065, total test script failed 215
So, the test case defect density is
215 X 100
—————————- = 16.8%
1280
This 16.8% value can also be called test case efficiency %, which depends upon the total number of test cases that uncovered defects
Defect Slippage Ratio:
The number of defects slipped (reported from production) v/s number of defects reported during execution.
- Number of Defects Slipped / (Number of Defects Raised – Number of Defects Withdrawn)
Example: Customer filed defects are 21, total defect found while testing is 267, and the total number of invalid defects is 17
So, the Slippage Ratio is
[21/(267-17) ] X 100 = 8.4%
Requirement Volatility:
The number of requirements agreed v/s number of requirements changed.
- (Number of Requirements Added + Deleted + Modified) *100 / Number of Original Requirements
- Ensure that the requirements are normalized or defined properly while estimating
Example: VSS 1.3 release had a total of 67 requirements initially, later they added another 7 new requirements and removed 3 from initial requirements, and modified 11 requirements.
So, the requirement Volatility is
(7 + 3 + 11) * 100/67 = 31.34%
Review Efficiency:
Review Efficiency is a metric that offers insight into the review quality and testing.
Some organizations also use this term as “Static Testing” efficiency and they are aiming to get a min of 30% defects in static testing.
Review efficiency=100* the Total number of defects found by reviews/Total number of project defects.
Example: A project found a total of 269 defects in different reviews, which were fixed and the test team got 476 defects that were reported and valid.
So, Review efficiency is [269/(269+476)] X 100 = 36.1%
Efficiency & Effectiveness of Processes:
- Effectiveness: Doing the right thing. It deals with meeting the desirable attributes that are expected by the customer.
- Efficiency: Doing the thing right. It concerns the resources used for the service to be rendered
Have questions? Contact the software testing experts at InApp to learn more.